The financial markets are a dynamic landscape, where prices can soar to new heights one moment and plunge unexpectedly the next. In this rollercoaster of uncertainty, investors seek tools to gauge and navigate the volatility inherent in the markets. One such tool that has gained prominence is the VIX Index.
Understanding the VIX Index:
1. What is the VIX Index?
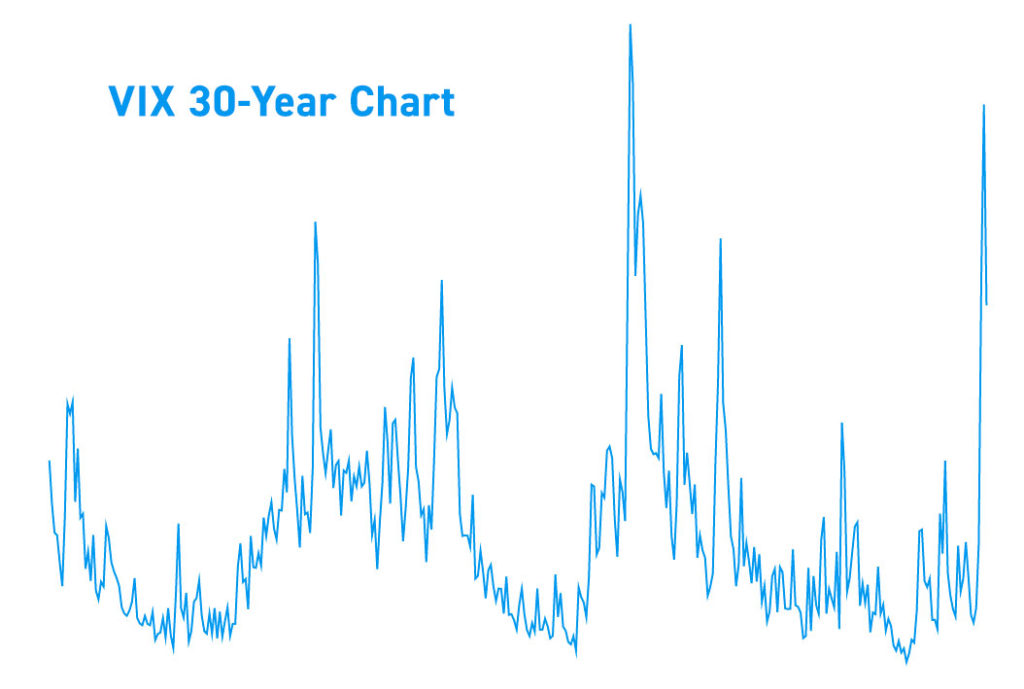
The VIX Index, or the Volatility Index, is a numerical measure of the market’s expectation of future volatility over the next 30 days. Often referred to as the “fear gauge,” the VIX provides insights into investor sentiment and the perceived level of risk in the financial markets.
2. Calculating the VIX:
The VIX is derived from the prices of options on the S&P 500, the leading benchmark for the U.S. stock market. Specifically, it reflects the market’s consensus on the expected future volatility by analyzing the premiums paid for options contracts.
3. Interpreting VIX Levels:
- Low VIX: A low VIX reading suggests that investors anticipate minimal market fluctuations. This may indicate a sense of complacency or confidence in the market’s stability.
- High VIX: Conversely, a high VIX reading signals heightened expectations of significant market swings. Investors may interpret this as an increased level of uncertainty or fear.
Practical Applications:
1. Risk Management:
Investors and traders use the VIX Index as a valuable tool for risk management. When the VIX is high, it may be an opportune time to reassess and adjust investment portfolios to mitigate potential losses during periods of increased volatility.
2. Market Timing:
The VIX can also be employed for market timing strategies. For example, a sharp spike in the VIX might indicate a potential market downturn, prompting investors to adopt a more defensive stance or even consider hedging strategies.
3. Contrarian Indicator:
Some market participants view extreme VIX levels as contrarian indicators. When fear is pervasive (high VIX), it may present buying opportunities for those willing to go against the prevailing sentiment.
Criticisms and Limitations:
While the VIX Index is a valuable tool, it’s not without criticisms:
- Limited Time Horizon: The VIX primarily reflects short-term expectations (30 days), potentially overlooking longer-term market trends.
- Equity Bias: As it relies on S&P 500 options, the VIX may not fully capture the volatility of other asset classes.
Conclusion:
The VIX Index serves as a crucial barometer of market sentiment and anticipated volatility. Investors can harness its insights for risk management, market timing, and as a contrarian indicator. However, like any tool, the VIX has its limitations and should be used in conjunction with other analyses for a comprehensive understanding of the market landscape. As financial markets continue to evolve, the VIX Index remains a powerful instrument for those navigating the unpredictable seas of investment.